About once a month or so we feature a blog post by Sean Kullman, Director of the Global Initiative for Boys and Men, and Substack author of In His Own Words. Sean’s analysis is always cogent, and data-driven.
This week we hope you will enjoy his study of reading scores and what is needed to ensure strong reading ability in children. The Gurian Institute works in this area with schools and we appreciate the mention by Sean in his blog post.
Go to any school board meeting, and you’re unlikely to hear much about a school’s reading scores and the programs that are helping students become proficient and advanced in reading. It’s also unlikely you’re going to see districts set targeted goals, say moving reading scores from 19% above standard (the California average in 2023 on the California Assessment of Student Performance and Progress) to 50% above standard.¹ There is little talk about using programs that are assessed and evaluated regularly as a way to make sure students goals are being met and teachers are learning about their own performance.
And when progress is or is not being met, how much time is a district spending on analyzing the data, sharing it with the community, and improving teacher training to make sure students are meeting targeted goals?
Like much of the nation, California has routinely struggled to produce proficient outcomes in K-12 public education, and an analysis of California Assessment of Student Performance and Progress (CAASPP) data allows for a comprehensive look at the state of modern education. The CAASPP data is plentiful, and it provides some demographic information but not nearly enough.
State Testing
State testing is an outcome measure of student performance, but school boards often overlook the finer elements of assessment that provide the type of information that can drive better outcomes, like efficacy of programs and teacher effectiveness. School boards need to discuss, quite openly, student growth percentiles (SGP) as a way to measure teacher and program effectiveness. Luke Rosiak points this out quite well in Race to the Bottom (chapter 2).
But regular evaluation of pedagogical effectiveness is not part of public school board meetings and reports, and school districts may even withhold data or claim data requests are a breach of student and teacher confidentiality, even when the data in the aggregate would avoid any such conflicts. (I know this firsthand, and it is something Rosiak points out.)
School boards routinely, for instance, conflate data; failing to disaggregate the data of males and females by race and sex. Even doing so by race and sex can miss underlying problems. When other factors are taken into consideration, such as students who come from single-parent homes and SGP, the eye toward improving student outcomes becomes clearer.
When I discuss this data with teachers, I’ve found a number of them quite open about the information and nodding, often in agreement, with the facts they experience in the classroom. It may be the reason teachers are the ones most likely to redshirt their sons when starting school, something Richard Reeves mentions in Of Boys and Men (Chapter 10). And Public school teachers are more likely than the general population to send their children to private schools. Some of these teachers may choose single-sex schools, faith-based schools, or schools that use an approach that recognizes sex differences as part of instruction, an approach covered extensively by the Gurian Institute. Teachers may also select schools with higher academic standards for their own children.
And while the school closures during COVID in 2019-20 and 2020-21 certainly played a role in the recent downward trends in student reading scores, outcomes have been poor for some time in California.
Even prior to school closures, fewer than 25% of CA students in 3rd through 8th grades and fewer than 30% of 11th grade students read above standard. Although 11th grade student outcomes are higher, it’s important to note that California’s dropout rate may play a part. California dropout rates are around 9%, according to the California Department of Education, and their scores may not be part of the assessed 11th grade students.
School boards may not know what to look for when it comes to actualizing data or may knowingly ignore information that better explains student outcomes. For instance, when parents look at English/Language Arts (ELA) scores on state tests, it’s important to understand that reading is only one of four categories on that California Assessment of Student Performance and Progress Test (CAASPP) as it is in many states.
The ELA score includes reading, writing, listening, and research/inquiry. The ELA score may give the impression of a higher reading proficiency, in part, because ELA is often equated solely with reading. The graph below makes a point of identifying and distinguishing “ELA” from “Reading Above Standard” of over three-million 3rd grade students in California by year from 2014 to 2023. Notice how much higher the percentage of students scoring proficient or advanced in “ELA” is than the percentage of students “Reading Above Standard.” The table below the graph gives a comprehensive look at 22.6 million student test scores from 2014 to 2023, distinguishing “Reading Above Standard” from “ELA.”
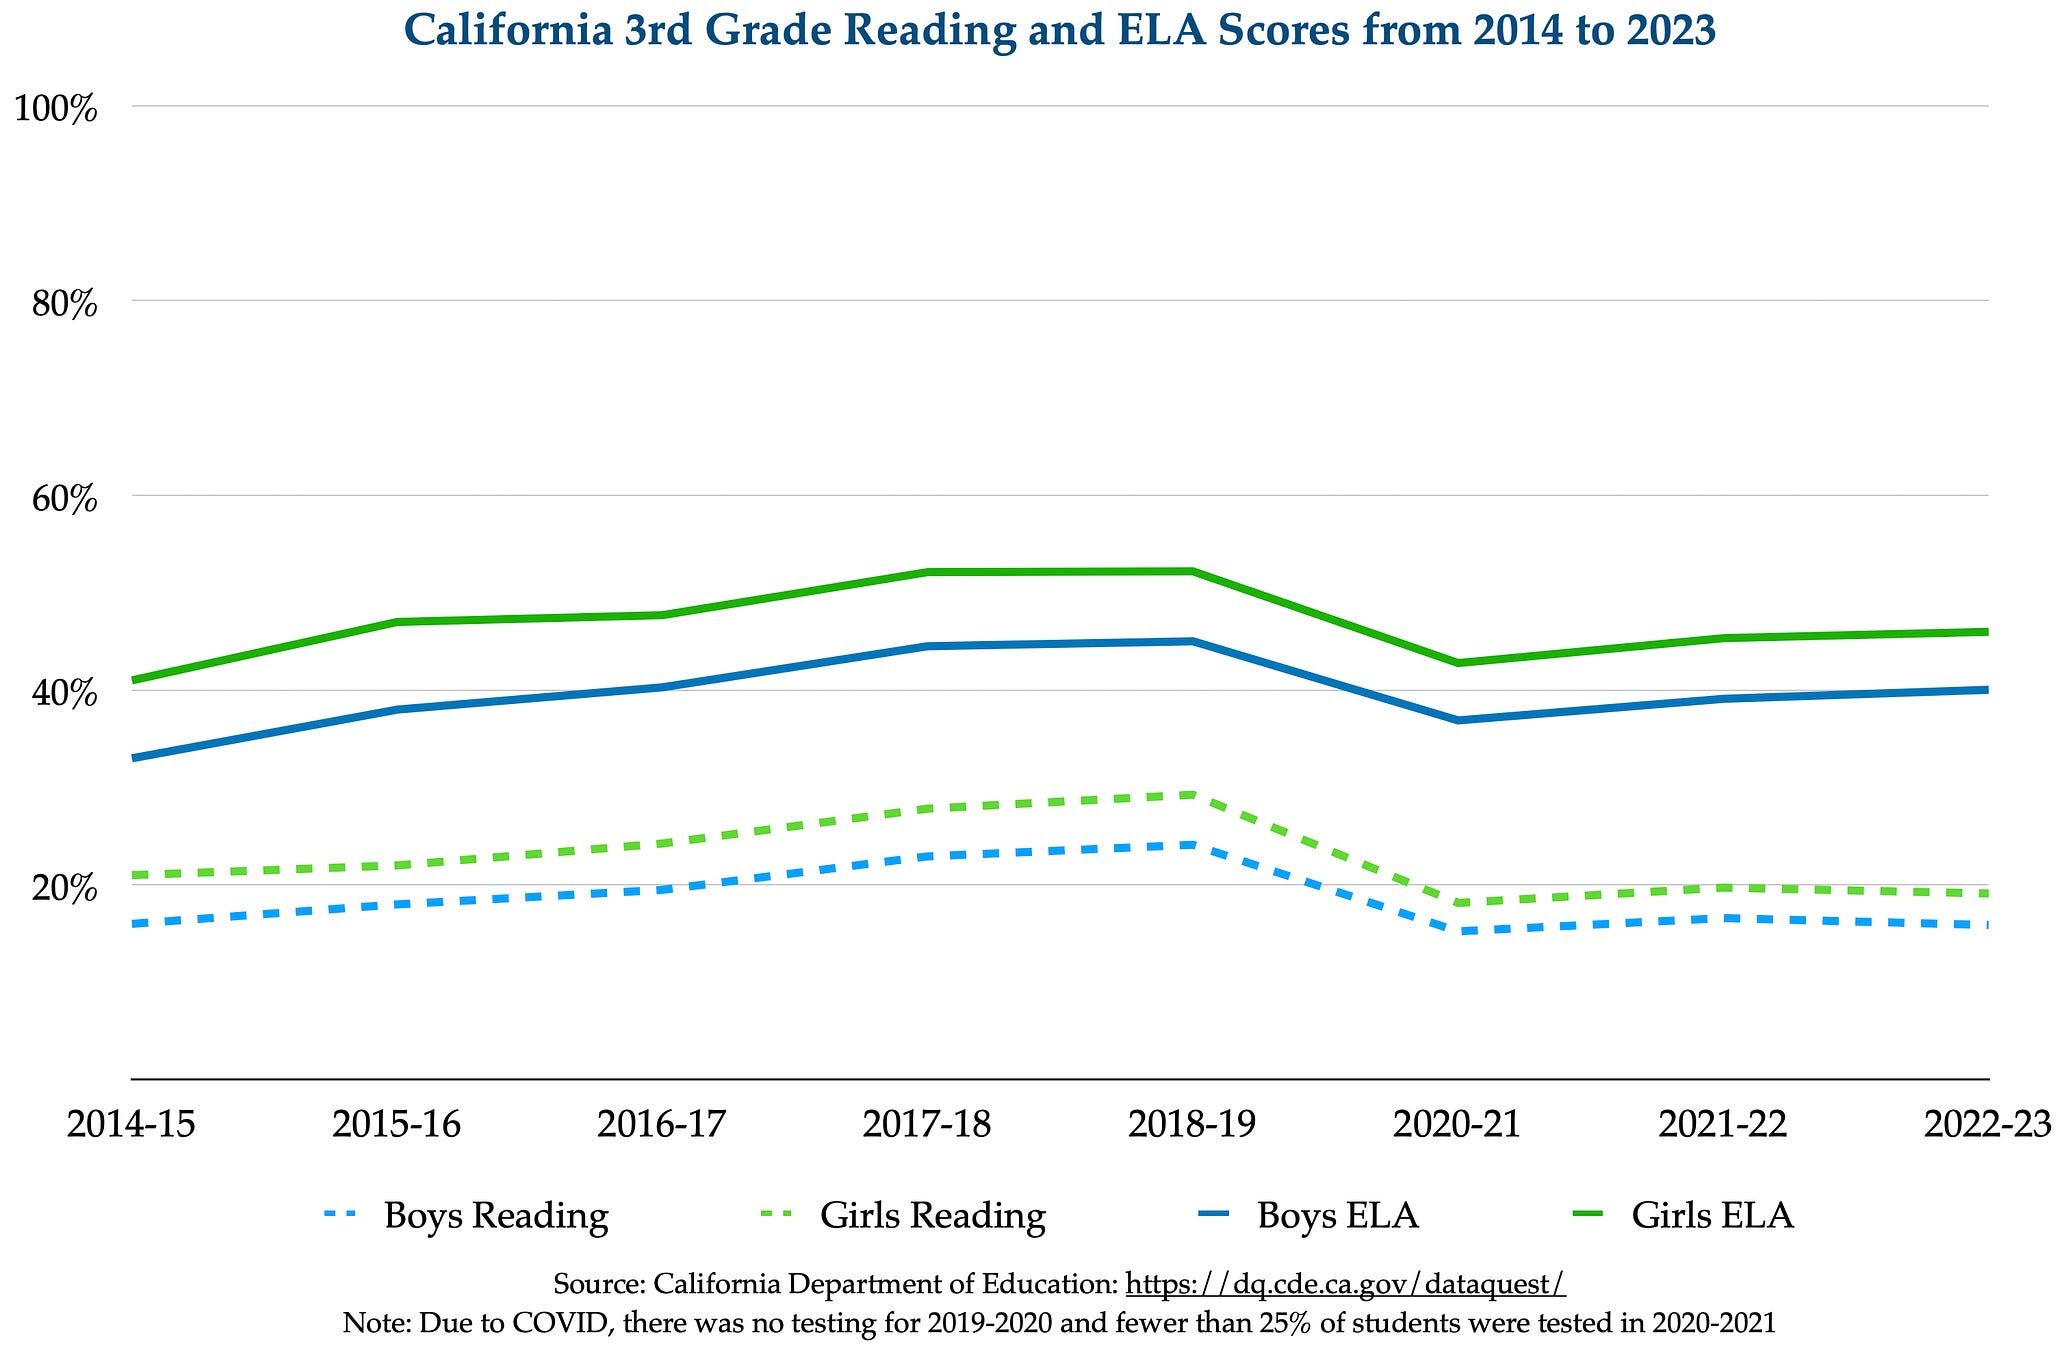
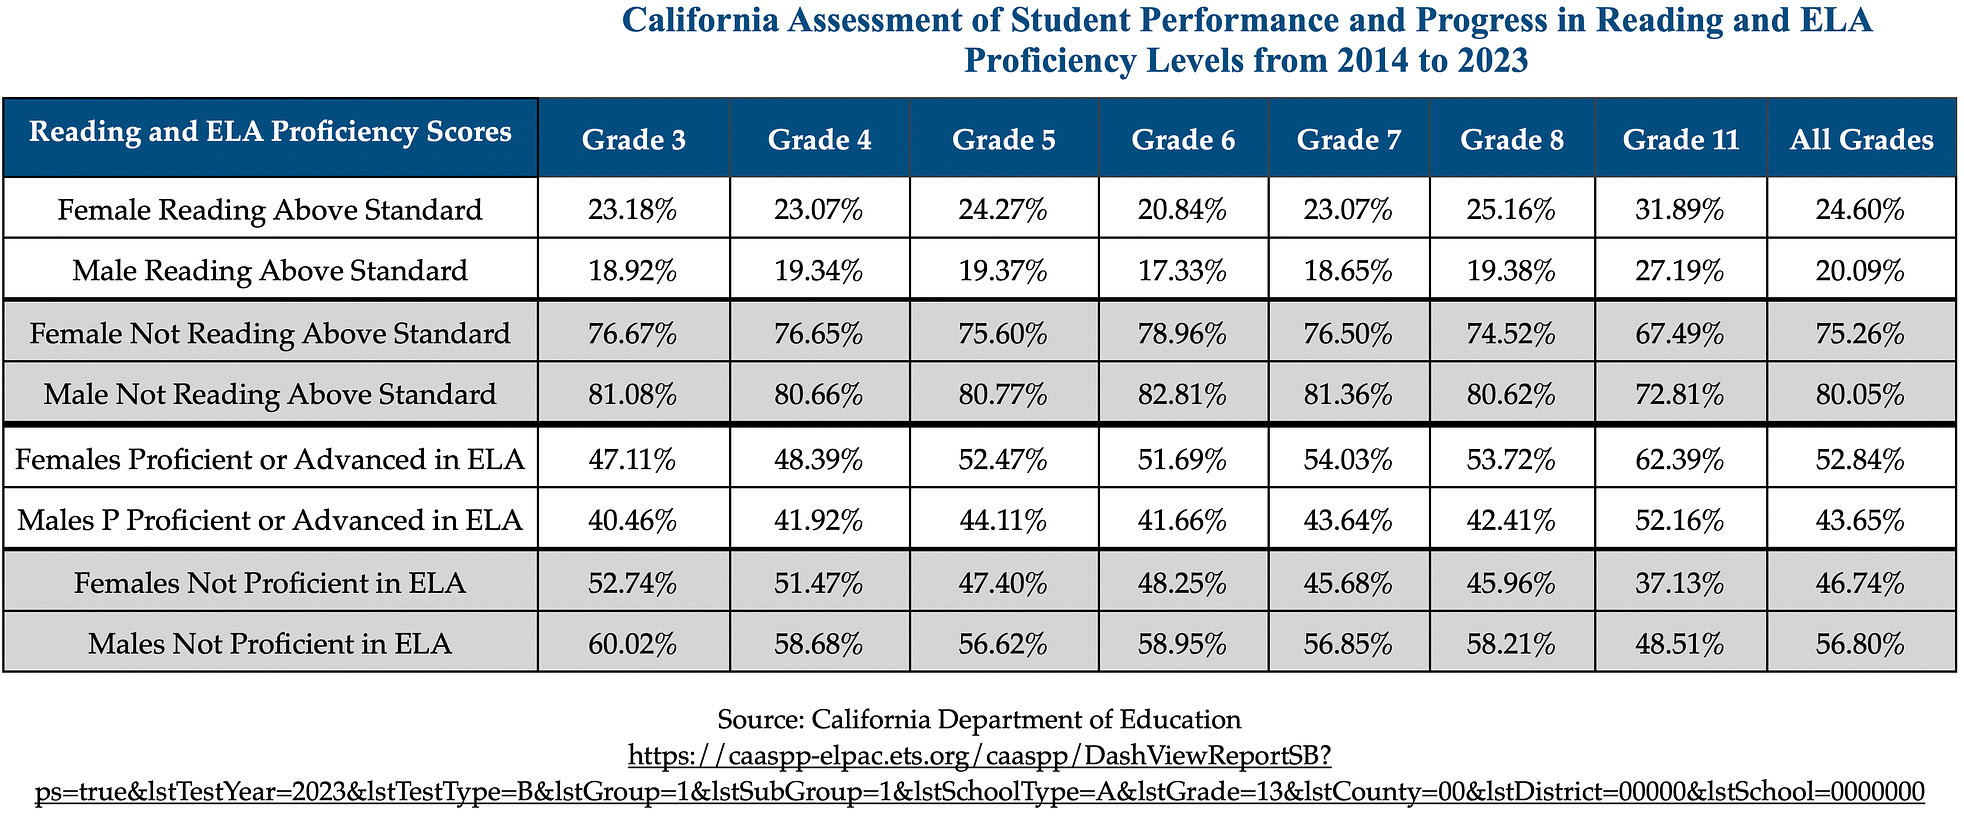
Although boys routinely score lower than girls in reading, girls too are struggling. However, more girls are advanced in reading and in ELA than boys.
From 2014 to 2023, over 400,000 more girls than boys scored above standard in reading and 840,000 more girls than boys scored advanced and/or proficient in ELA. It should also be noted that nearly 500,000 more males tested during those years, as males under 18-years-of-age slightly outnumber females. Additionally, many schools did not test during the school closures or the disparities would be greater.
840,000 more girls than boys scored advanced and/or proficient in ELA.
One teacher I spoke with mentioned the amount of funding moving away from the classroom and into district-level administration and ideological programs. The Oakland Unified School District’s superintendent’s (Kyla Johnson-Trammell) has a district-paid benefits package ($97,942.20) that is nearly double the starting teacher’s salary ($52,000) in Oakland. Trammell’s total salary and benefits is over $450,000 annually. The top 5 administrators in Pleasanton Unified School District, a desired school district in the East Bay, have a combined base salary of 1.4 million annually, with the superintendent, David Haglund, making $370,000.
Even as districts like Pleasanton Unified have seen a decrease of 9% in student enrollment from 2014 to 2023, its human resources and administrative staff have increased, often to the detriment of teacher salaries and student services said one teacher undergoing teacher salary negotiations. And the teacher has a point. Reading scores have dramatically dropped and administrative bloat has continued to move resources away from the classroom. There has been a conscious shift away from more robust instruction, student growth measures, and teacher compensation and evaluation.
One central administrator can easily weaken and disrupt the function of principals and teachers. Would reading scores go up if there was more autonomy at the school level that could be measured, reported-on, and shared with teachers and the community? Do schools need fewer central administrators and more resources in the actual schools?
Although socio-economics plays a role in student outcomes, too much emphasis on socio-economics and not enough focus on effective pedagogy, learning environments, and family dynamics lead school boards down the rabbit hole of programs that distract schools from effective education and into other concerns.
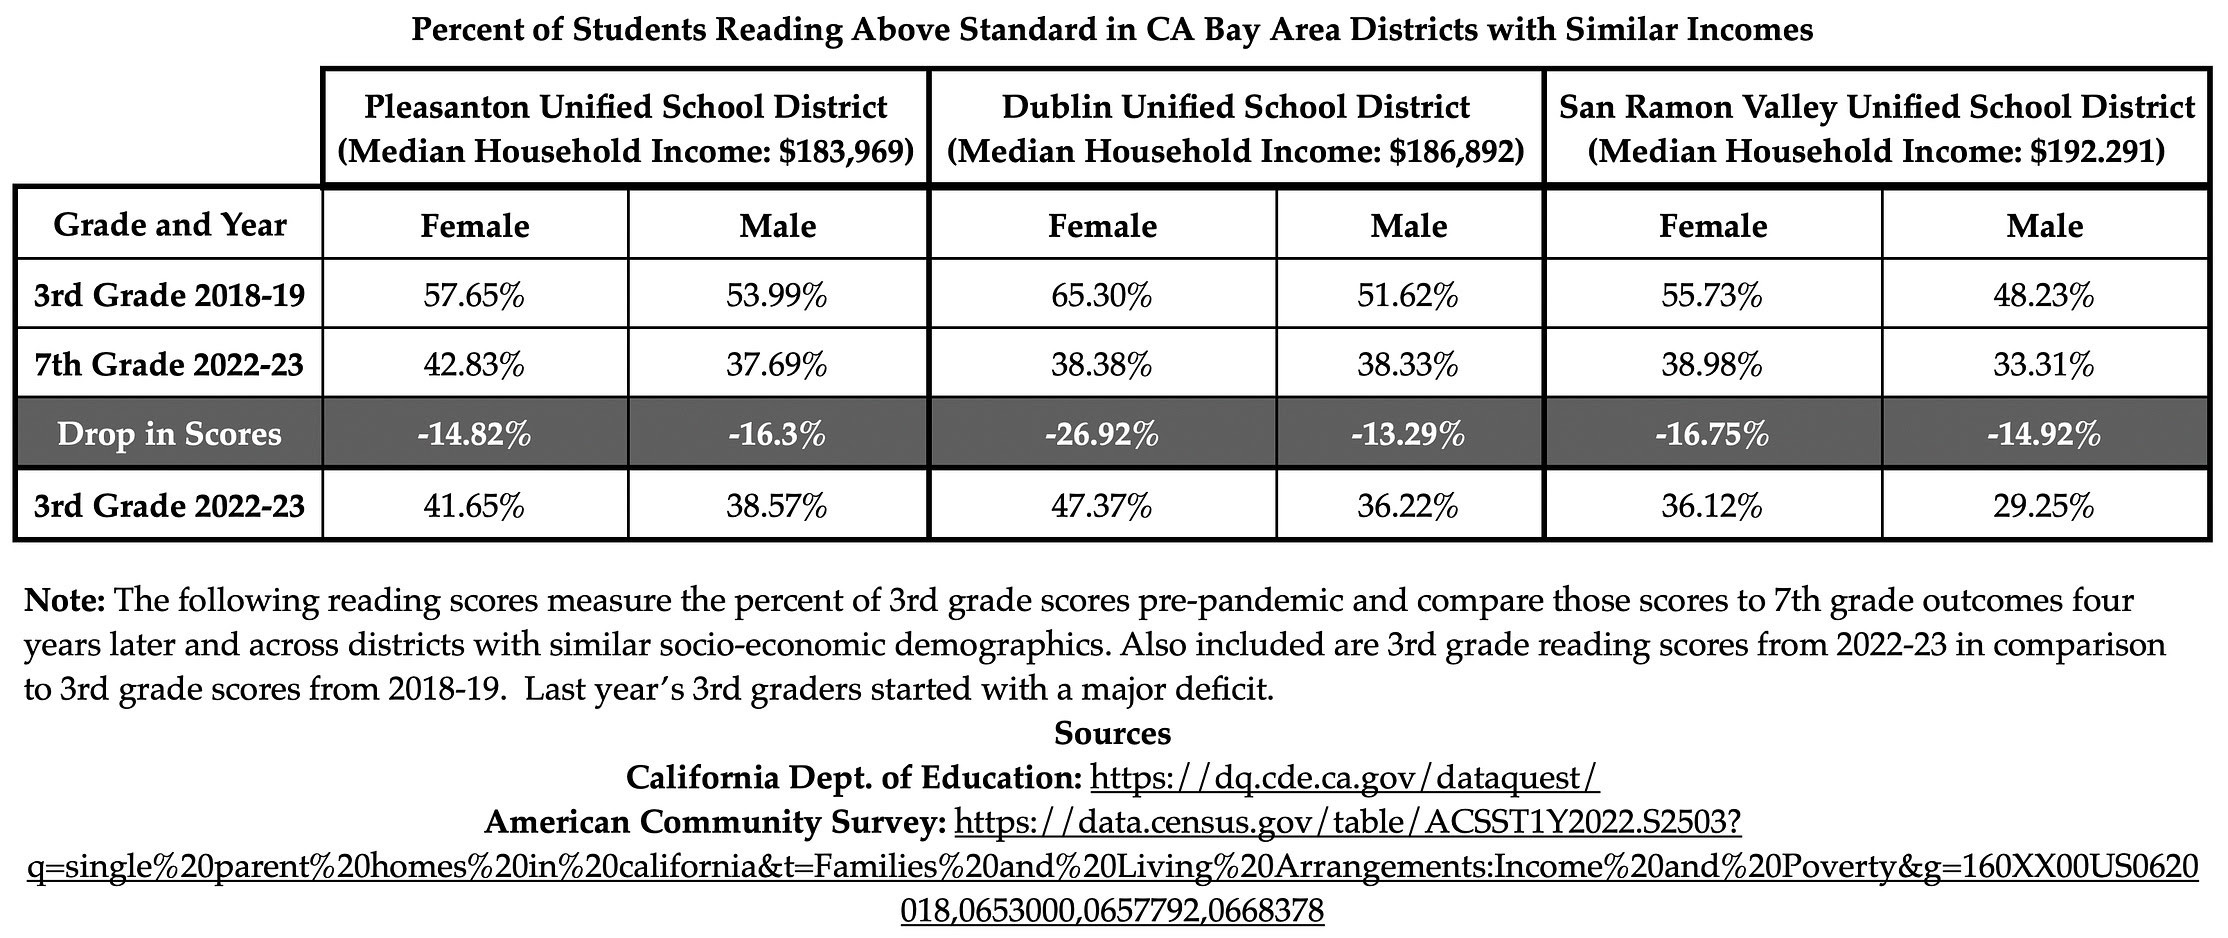
The table below shows the reading scores of 3rd graders pre-COVID and their scores four years later in 7th grade, post-COVID. Regardless of the median household income, wealthier communities showed larger drops in reading scores than communities with lower median incomes. Other wealthier communities in the Bay Area (Dublin and San Ramon) also showed drops. This observation is emphasized by Rosiak in Race to the Bottom.
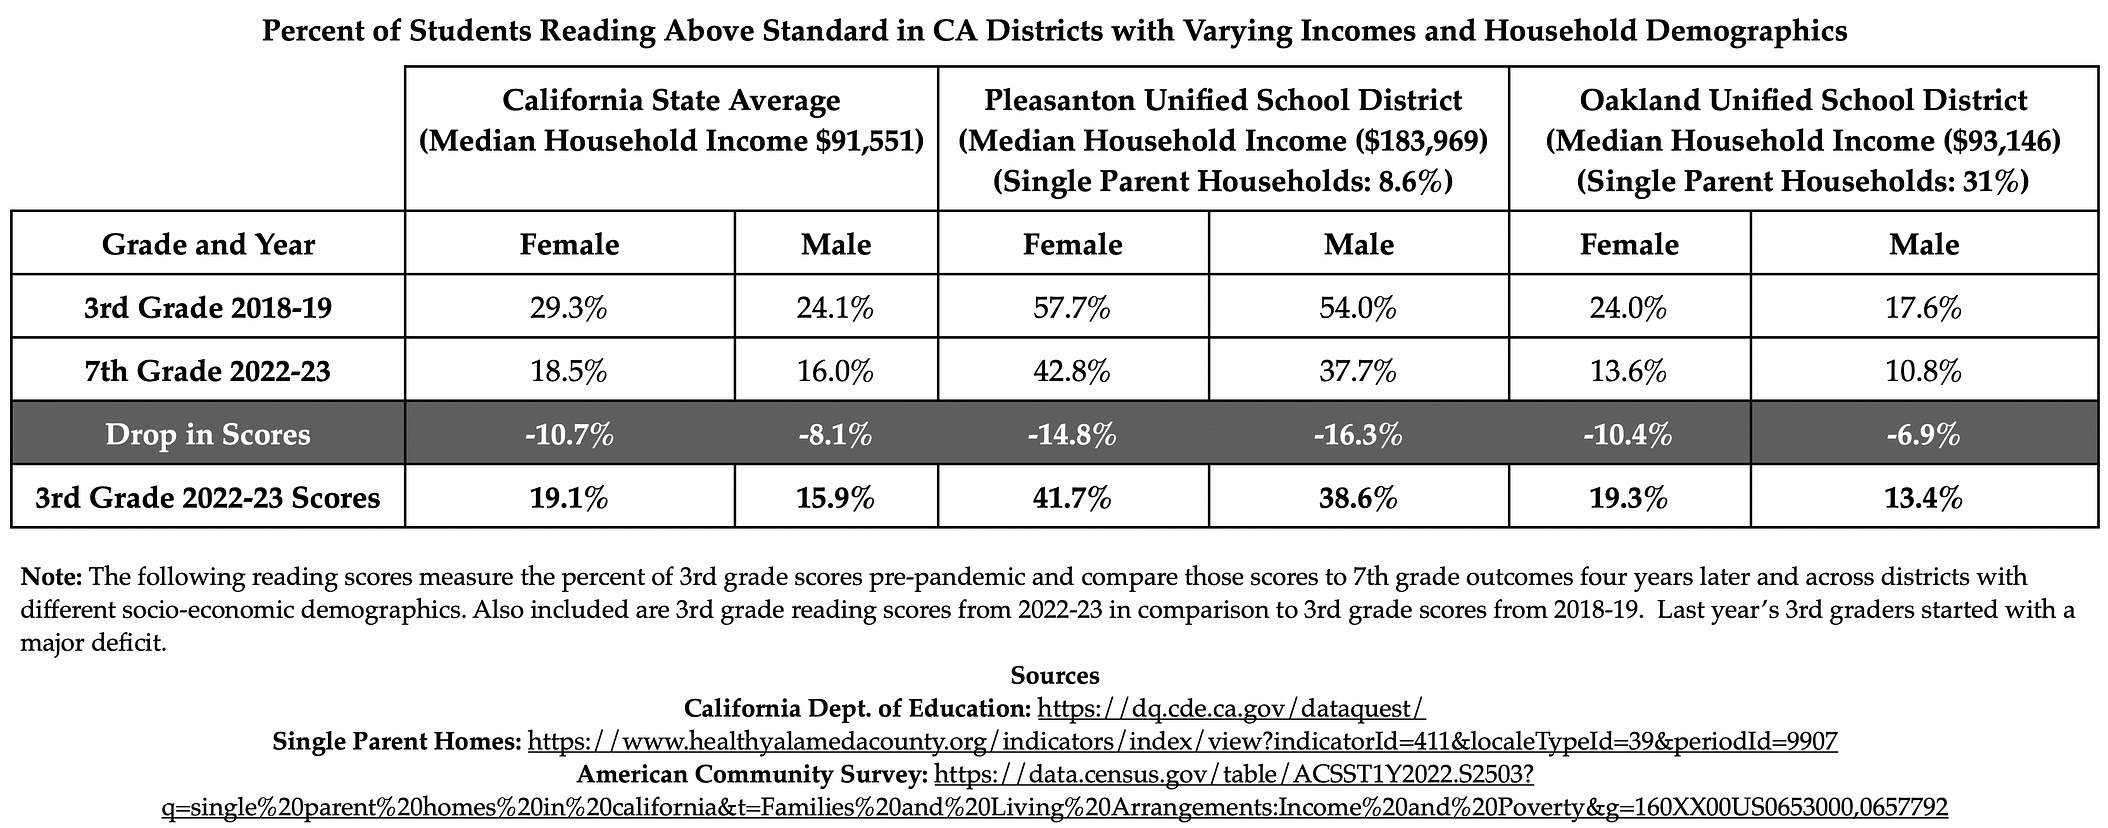
The myopic view of U.S. educators—that the problem is a “gap” between wealthy and impoverished students—distracted parents from seeing whether anyone was doing well. Wealthy parents comforted themselves that grim educational statistics were an inner-city problem, that their kid was doing fine—or even that, compared to other kids nearby, he was a genius. They had been deceived. The 2009 Program for International Student Assessment (PISA) test, for example, showed that kids at a Loudoun high school performed worse in math and reading than kids at some comparably wealthy schools in Mexico. Growth scores humbled many wealthy and “desirable” schools: it turned out that they were not actually very good; they just had parents who sent their kids to school well prepared.
The student growth percentile (SGP) metric, also called a value-added metric, was no statistical mirage. Economists who studied eighteen million test scores over twenty-one school years found that even when a teacher transferred to a different school, his or her performance stats remained similar. In Virginia, a teacher ranking in the bottom fifth one year was most likely to be in the bottom fifth again the next year, with only a 3 percent chance of moving to the top fifth.”
“A 2011 study by economists, including Harvard’s Raj Chetty, found that ‘when a high-value-added teacher enters a school, test scores for students in the grade taught by that teacher rise immediately…. And the gains don’t stop there…’” (Rosiak, Chapter 2).
How is my child learning to read?
In Pleasanton Unified School District, for instance, the district uses two reading curriculums (Benchmark and Units of Study) in elementary school, allowing a teacher to select which curriculum to employ in her/his classroom. The programs have different approaches when it comes to teaching reading and the Benchmark program has not been updated in years. It’s very possible that a student will use one program in second grade and a different program in third or fourth grade with the possibility of switching again in 5th grade, leading to inconsistent pedagogical approaches and an uncertainty about producing better outcomes.
Are reading scores better for students who use the Benchmark or Units of Study approach? Does one program work better for certain types of learners? Are certain teachers doing a better job getting struggling readers to become proficient and proficient readers to become more advanced?
Many school boards do not report on this type of data. The same is true with math curriculums. Although some are quick to blame teachers for poor outcomes, school boards play a critical role by providing the type of feedback that reveals curricular approaches that work, providing new and current teachers with the resources to succeed, employing programs that function at the school level and away from the central office, and sharing those demonstrable measures with the entire community.





Thank you for the insightful guest blog post on your website! Sean Kullman’s perspective on a child’s journey to reading is both informative and engaging. The emphasis on understanding individual learning styles is a valuable approach, and the post adds significant value to the ongoing conversation about literacy.